


Did you know that 91 countries participated in the 2025 PISA assessment?¹
What makes PISA unlike other academic assessments is that its questions are designed to evaluate whether students are capable of applying their knowledge and skills beyond a fixed school curriculum and educational setting.
For students, educators, parents, and policymakers, the PISA results can help identify the knowledge and skills gaps that students are experiencing, as well as gauge whether they are on the right track to be future-ready and equipped to participate in an increasingly technology-driven world.
Who takes it: Around 760,000 15‑year‑old students took the PISA 2025 assessment
What it measures: Students' ability to apply reading, mathematics, and science skills in real-life situations
How often it takes place: PISA has run every three years since 2000, but the OECD plans to move to a four‑year cycle from 2025 onwards 2


What is PISA and how does it work?
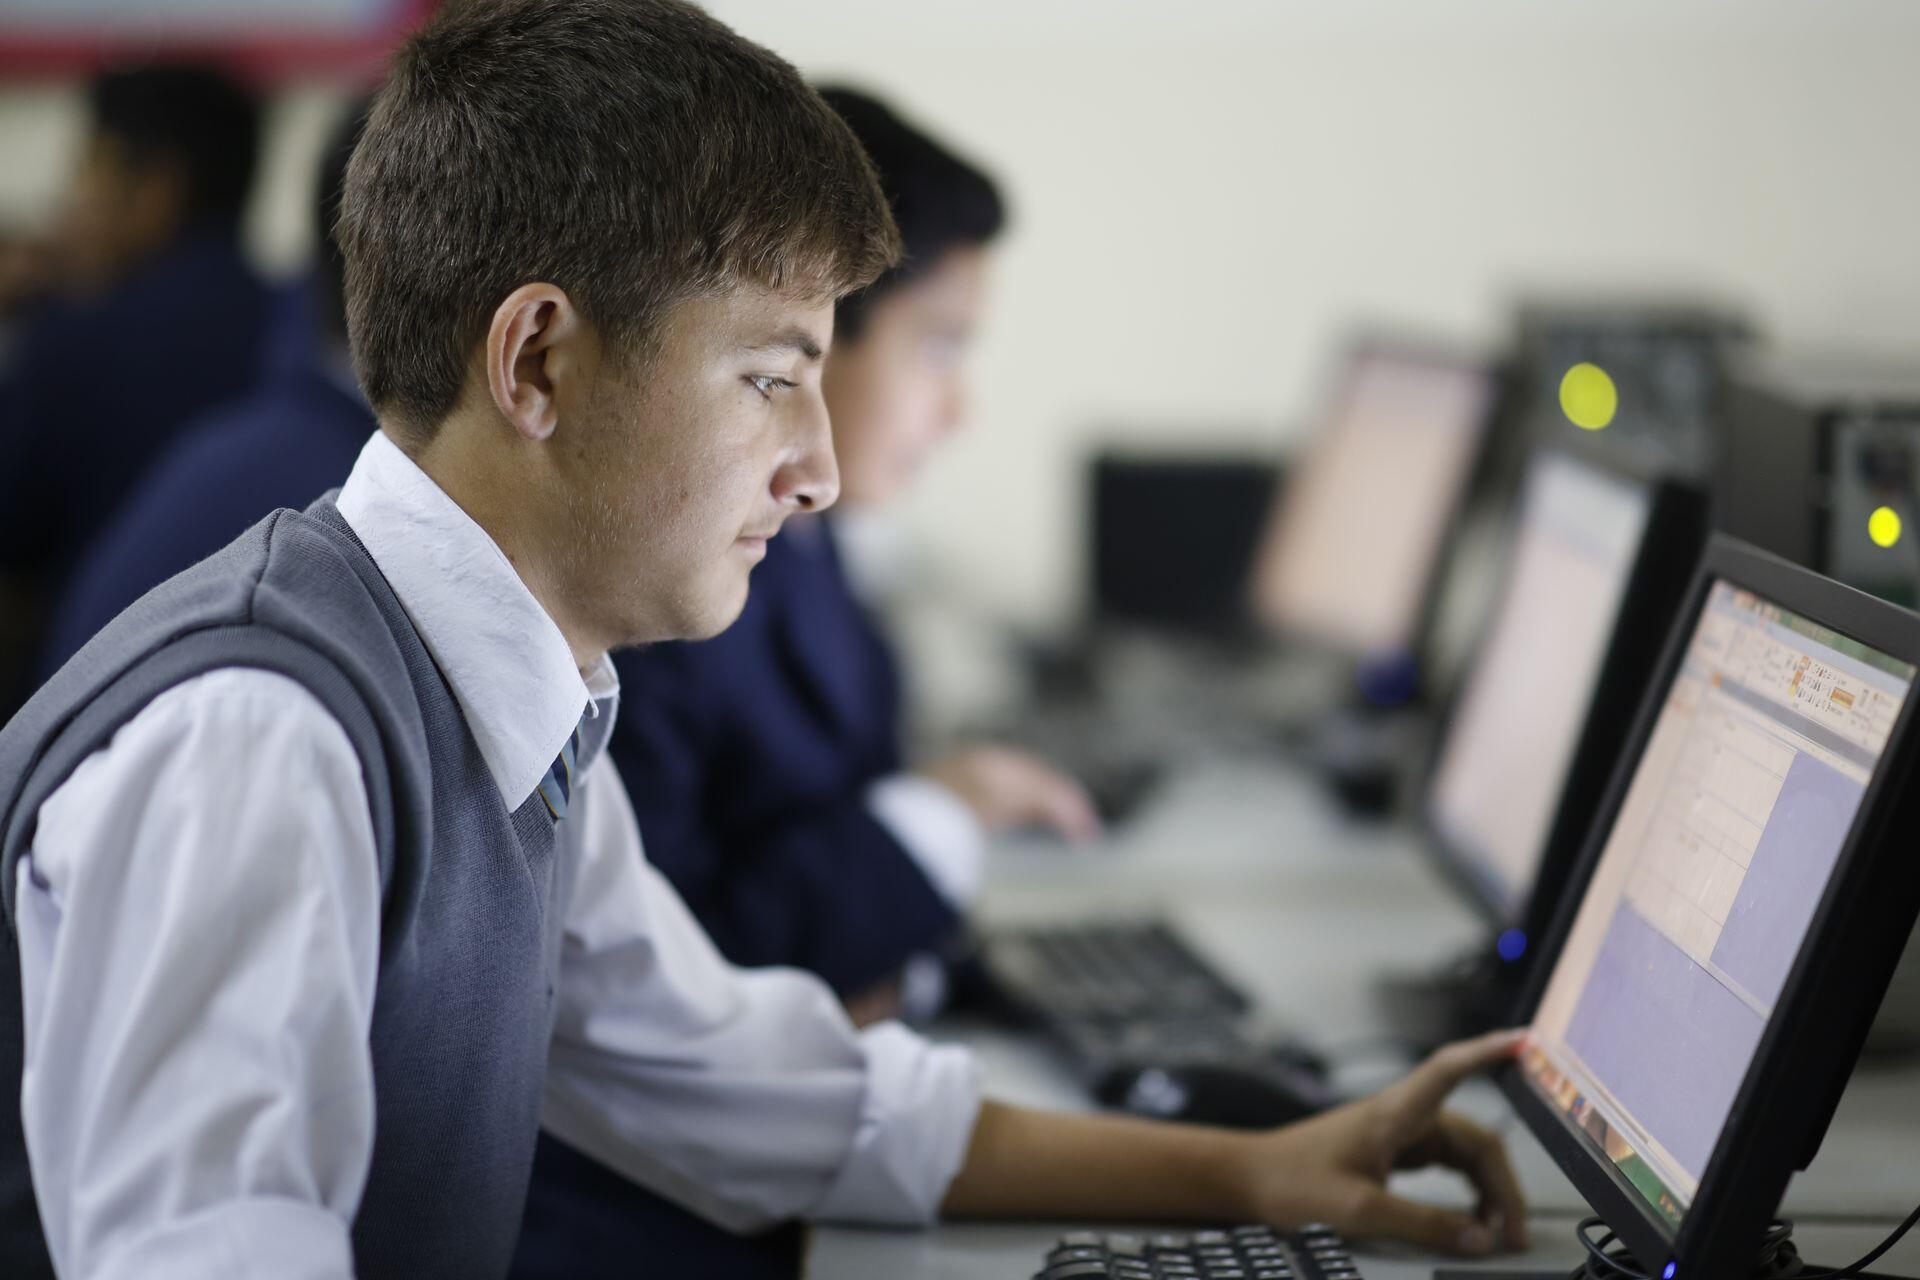
Created by the Organisation for Economic Co-operation and Development (OECD), PISA, which stands for the Programme for International Student Assessment, is an internationally recognised and administered computer-based assessment for 15-year-old students.
Each cycle assesses the three core domains but places considerably greater emphasis on one of them, which serves as the major domain for that cycle:
- Mathematics
- Science
- Reading
Rather than testing every student in a country, PISA is a sample‑based international assessment designed to represent each country’s 15‑year‑old population. It goes through a thorough testing cycle, sampling, and assessment approach.3
| Step | What happens | Key details |
|---|---|---|
| 1. Define target population | OECD specifies that PISA assesses 15-year-old students in public and private schools in each participating country/economy. | Ensures comparability across countries and cycles. |
| 2. Create school sampling frame | Each country compiles a complete list of schools with 15-year-olds, including enrolment numbers. | Basis for statistically representative sampling. |
| 3. Select schools (Stage 1) | Schools are selected using a stratified, systematic sample with probability proportional to size. Larger schools are therefore more likely to be chosen. Typically, at least 150 schools are selected per country. | Designed to represent all regions and school types. |
| 4. Select students within schools (Stage 2) | In each selected school, a list of all 15-year-olds is made; around 42 students are randomly chosen with equal probability. If fewer than 42 are available, all 15-year-olds are tested. | Produces a representative sample of 15-year-olds. |
| 5. Administer cognitive test | Selected students sit a computer-based test lasting about 2 hours, covering science, mathematics, reading and the innovative domain — in 2025, Learning in the Digital World. | Items include multiple-choice and constructed-response tasks based on real-life scenarios. |
| 6. Complete questionnaires | Students fill in a background questionnaire (about 30–40 minutes) on home, attitudes, digital use and wellbeing. Schools complete a questionnaire on resources and policies. | Enables analysis of performance alongside contextual factors. |
| 7. Data processing and scaling | Responses are scored and scaled using item response theory so that students are placed on a common scale for each domain, even though they saw different items. | Produces comparable scores across countries and cycles. |
| 8. Reporting results | OECD publishes mean scores, proficiency levels and distributions for each domain, plus analyses by gender, socioeconomic status, school type and other factors. | Results inform policy, research and public debate; they are not used as individual student grades. |
The primary purpose of PISA is to go beyond testing knowledge and testing the ability to apply knowledge and skills (which is common in schools) and actually seeing the application of knowledge and skills in the real world.
Many countries, including the UK, are willing to participate in this global assessment because it provides a common statistical framework that is repeated over time — every three to four years, allowing them to track changes and identify improvements across the three subjects.
2000
Introduction of the first PISA cycle
Reading is the major domain in this cycle
2003
Expansion of participating countries.
Mathematics is the major domain in this cycle
2006
Greater emphasis placed on scientific enquiry
Science is the major domain in this cycle
2009
New non-OECD participants joined this cycle
Reading is the major domain in this cycle
2012
Introduction of new frameworks in assessments
Mathematics is the major domain in this cycle
2015
Transition to computer-based assessment in most participating countries.
Science is the major domain in this cycle
2018
The focus of the study leans more on digital reading
Reading is the major domain in this cycle
2022
PISA cycle delayed by one year due to the pandemic
Mathematics is the major domain in this cycle
2025
Introduction of a new innovative domain: “Learning in the Digital World”
Science is the major domain in this cycle
2029
The 10th PISA edition's major domain would be reading.
The new innovative domain announced is Media and Artificial Intelligence Literacy (MAIL).
What does PISA measure?
PISA measures these three subjects every cycle, with one becoming the main domain on a rotating basis. This means that PISA can examine trends across all three areas while periodically undertaking a much deeper assessment of each one.
📖 Reading
How well 15-year-olds can understand, use and reflect on written texts to achieve goals, develop knowledge and participate in society.
🔢 Maths
Ability to formulate, employ and interpret mathematics in a variety of contexts, including reasoning with numbers, patterns, shapes and data.
🔬 Science
Capacity to use scientific knowledge and processes to explain phenomena, evaluate evidence and engage with science-related issues.
🌐 Learning in the Digital World
Students’ ability to learn and solve problems using digital and computational tools, including computational problem solving and self-regulated learning in unfamiliar digital environments.
In addition to the cognitive tests in science, mathematics, reading, and the innovative domain, PISA also collects extensive background and contextual data through questionnaires.
Based on the PISA 2025 Assessment and Analytical Framework, these data are grouped into three broad areas:
Includes demographic, economic, social, and cultural (ESCS) data, as well as language background and migration, including movement from rural to urban areas.
Covers school culture and climate, school type and resources, as well as selection and enrolment, class size, and school autonomy
Includes students' social and emotional characteristics, growth mindset and overall well-being, as well as their preparedness for life after secondary school
Together, the data provide context for understanding why performance may differ between students, schools, and countries.
What's new in PISA 2025?
The 2025 cycle retains the traditional core of reading, mathematics, and science, but science becomes the major domain.
Major domain: Science, with reading and mathematics as the minor domains.
Innovative domain: The introduction of Learning in the Digital World 4
Bonus: Optional Foreign Language Assessment (FLA), focused on English, taken by some participating countries
The innovative domain, Learning in the Digital World (LDW), plays a significant role in evaluating how effectively students can learn and solve problems in digital environments. 5
It focuses on two competencies:
🧠 Self-regulated Learning
The ability to monitor and manage your own learning — including your thinking, motivation and behaviour.
💻 Computational Problem-solving
The ability to choose and use digital tools effectively to explain ideas, explore problems and find solutions.
The PISA 2025 assessment for Learning in the Digital World had two main components:
- A cognitive assessment that evaluates how students learn and solve problems using computational tools and practices in digital environments
- The Information and Communication Technology (ICT) Familiarity Questionnaire
For students, parents, and tutors, the assessment of this domain is intended to measure skills such as self-regulation, experimentation, computational thinking, and problem-solving, which can help students adapt as digital environments continue to evolve.
What do the latest PISA results tell us?
The first PISA 2025 results were released by the OECD on 8 September 2026. The initial release covers the principal achievement findings, while additional results from the 2025 cycle are scheduled for subsequent publications.
Here are some key takeaways 6:
Across OECD countries, average scores fell by 14 points in reading and 9 points in mathematics between 2022 and 2025.
Science performance has remained broadly stable since 2022, but around one in five 15-year-olds are now low performers.
In science, 37% of disadvantaged students were low performers, compared with 12% of advantaged students across the OECD.
Which countries perform best in PISA?
PISA 2025 shows that a small group of countries and economies consistently perform strongly across science, mathematics, and reading.
B-S-J-Z China (the Chinese jurisdictions of Beijing, Shanghai, Jiangsu, and Zhejiang) and Singapore are the two highest-performing systems across all three core domains.
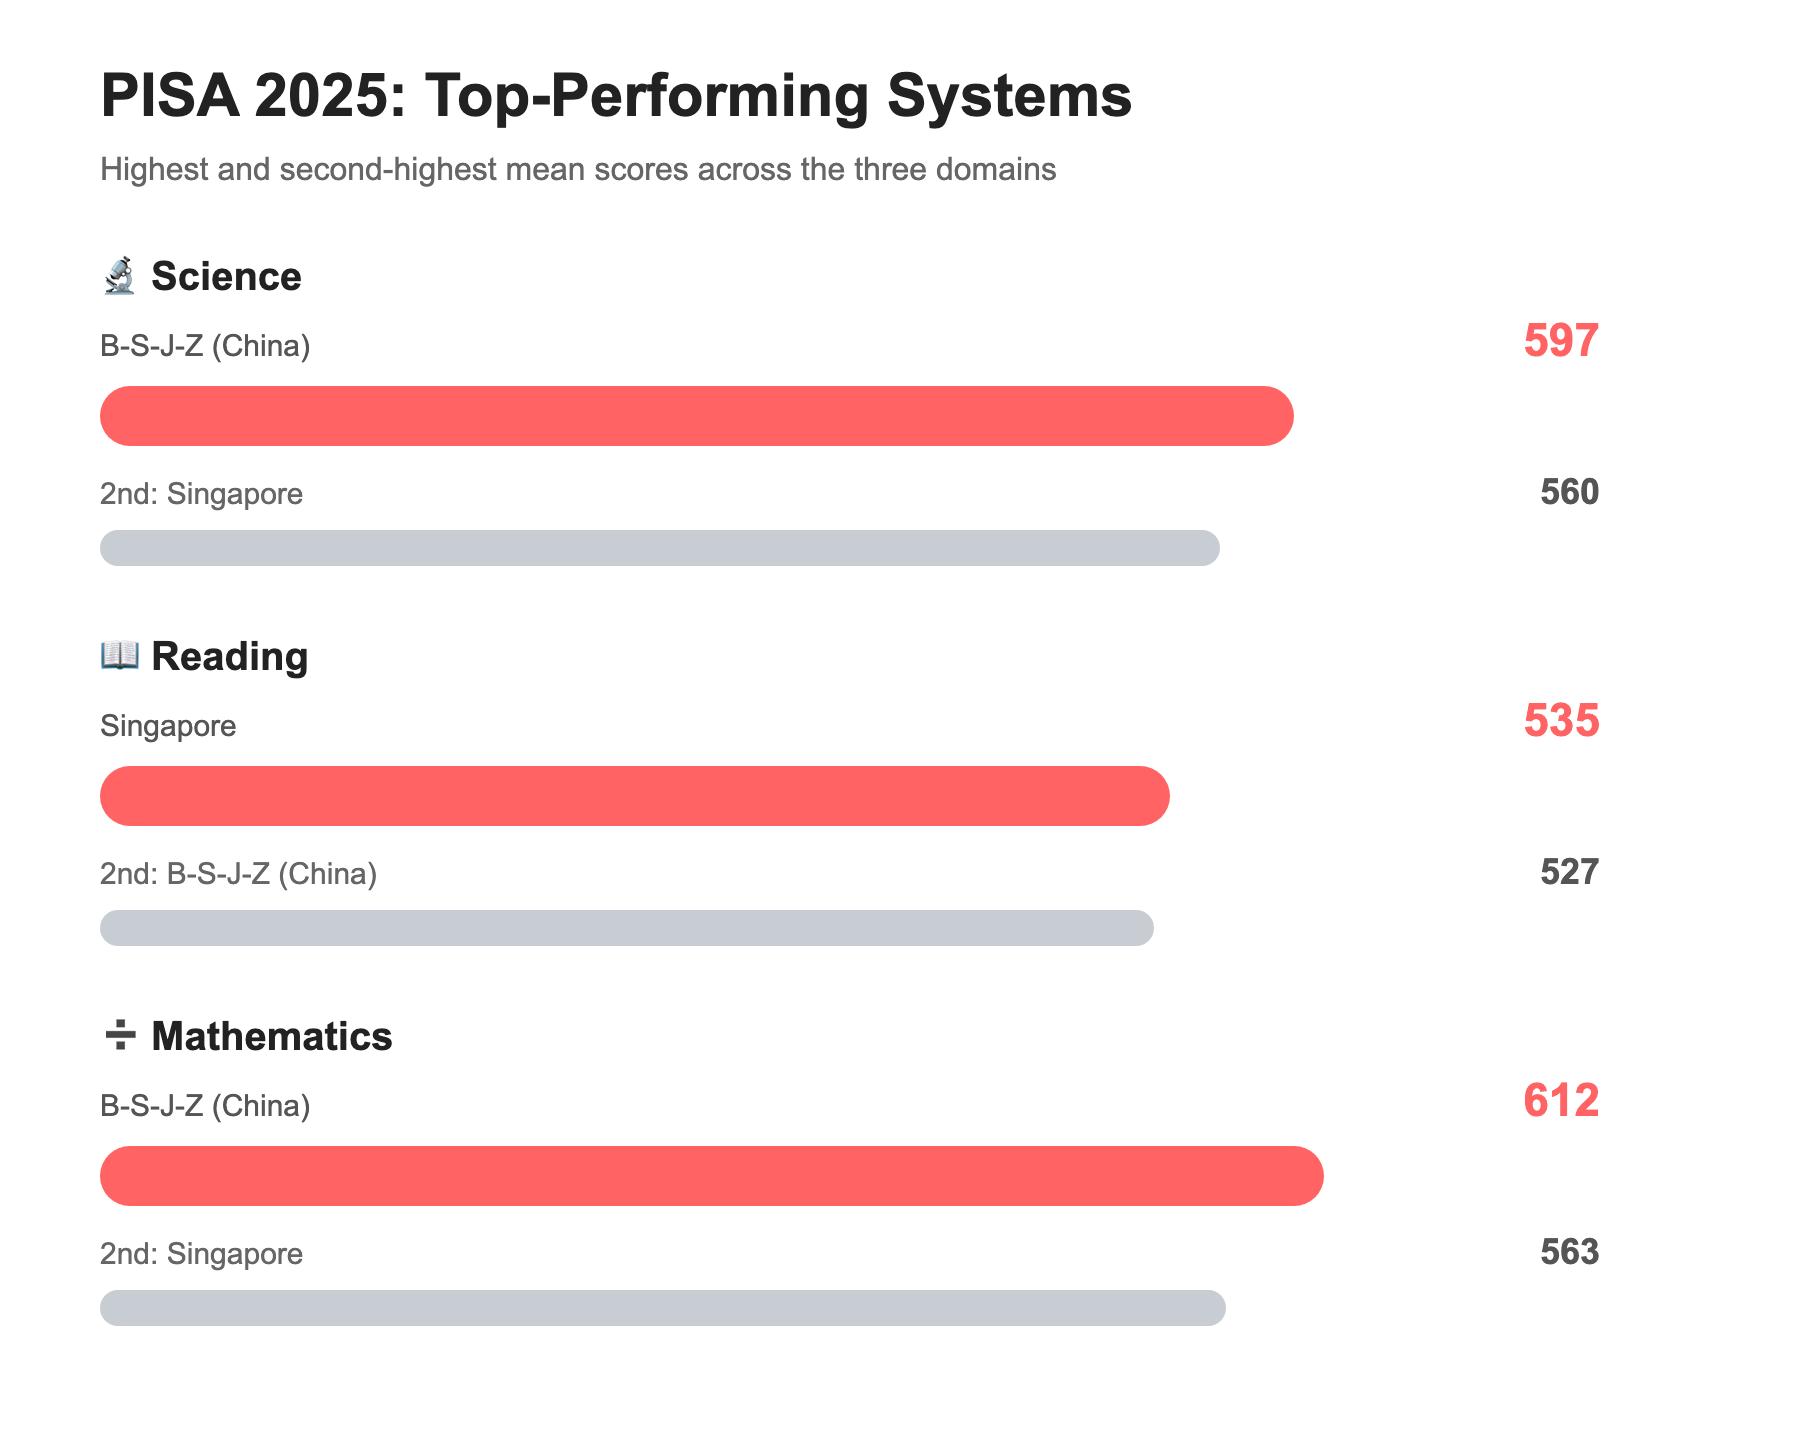
Several other systems also appeared among the highest performers across all three subjects, including Estonia, Japan, Korea, Macao (China), Chinese Taipei and the United Kingdom.
What are the biggest trends in student achievement?
Here is an overview of student performance trends from the largest PISA assessment conducted to date, revealing a mixed picture. 8
| Trend | What the latest PISA results show | Evidence |
|---|---|---|
| 📖 Reading performance is declining | Reading has experienced the steepest long-term decline among the three core subjects. | The OECD average fell 28 points between 2015 and 2025, including a further 14-point fall between 2022 and 2025. |
| ➗ Mathematics has fallen sharply | Mathematics was relatively stable in earlier cycles but has declined markedly since 2018. | The OECD average fell 22 points between 2015 and 2025, with another 9-point decline between 2022 and 2025. |
| 🔬 Science has been more resilient | Science has declined more gradually and was broadly stable between 2022 and 2025. | Science was unchanged on average across 35 OECD countries between 2022 and 2025, although its 2025 level remained below earlier peaks. |
| ⚖️ Performance gaps remain substantial | Lower-performing students have not kept pace with higher-performing peers. | Between 2022 and 2025, the gap between the 10th and 90th percentiles widened by about 8 points in mathematics and 3 points in reading. |
| 🌍 Countries are not moving in the same direction | International trends are not uniform: some systems improved while others declined or stabilised. | In science, Costa Rica, the Slovak Republic, Türkiye and the United Kingdom improved between 2022 and 2025 despite broader OECD stagnation. |
| 🦠 The decline predates COVID-19 | The pandemic disrupted schooling, but performance weaknesses were already emerging before COVID-19. | Mathematics began falling particularly sharply after 2018, while reading had already been declining after its earlier peak around 2012. |
How do countries use PISA results?
Countries that participate in PISA often use its results as a policy tool to reform their teaching and learning priorities and structures, rather than simply using them to rank educational performance.9
Here are three examples:
Many countries have revised their curricula to place greater emphasis on problem-solving, real-world application and scientific enquiry.
Some countries have strengthened national testing and school evaluation frameworks, using PISA findings alongside their own national evidence.
Participating countries also emphasise formative assessment, classroom management and ongoing teacher development to support effective teaching.
Having said that, different countries interpret and respond to PISA differently depending on their own education systems and future education goals.
Germany's early PISA results triggered a “PISA shock”. This helped drive new education standards, closer school monitoring and greater support for disadvantaged and immigrant students.
Qatar uses PISA as an international yardstick within a broader education reform effort covering teaching, curriculum, assessment and school development.
After a fall in PISA performance, Japan held a major national debate about education. The government later adjusted its “low-pressure” curriculum and introduced a national academic assessment.
Brazil has used PISA as an international benchmark alongside reforms to its national assessment system, including SAEB.
Finland's strong PISA performance created a “PISA surprise” internationally. Rather than introducing major reforms because of PISA alone, Finland used the results alongside its existing education debates.
PISA results fed into debates about student performance and fairness. This was followed by greater focus on national testing, school evaluation and support for disadvantaged and immigrant students.
What do PISA results mean for the UK?
The UK has participated in PISA since 2000, with results reported by the OECD for the UK as a whole. The four education administrations, England, Scotland, Wales, and Northern Ireland, also publish their own national analyses because each has its own curriculum, qualifications, and assessment systems.
PISA complements domestic assessments such as GCSEs, A-levels, and national assessments.
PISA: An internationally focused assessment targeting 15-year-old students
GCSEs and A levels: Part of the UK's formal qualifications with specific subjects
National assessments: Track students' progress at different stages of schooling
Here's an overview of PISA UK results in 2025 and its four education systems. 10
| Country / nation | Science | Reading | Mathematics |
|---|---|---|---|
| England | 516 | 497 | 492 |
| Scotland | 491 | 488 | 467 |
| Northern Ireland | 492 | 482 | 473 |
| Wales | 476 | 459 | 456 |
| United Kingdom | 511 | 494 | 488 |
| OECD average | 482 | 461 | 463 |
The PISA results show that educational performance varies considerably across the UK.
- England remained above the OECD average in all three subjects, while Scotland and Northern Ireland also performed above the OECD average in several areas.
- Wales recorded lower scores, particularly in mathematics and science.

How should you interpret PISA scores and rankings?
The assessment should not be used by schools and local jurisdictions for developing rankings or league tables.
OECD, PISA‑based Test for Schools: Guidelines – 2025, p. 8
Even though countries are ranked by their PISA scores, it is important to look beyond the rankings and understand what the scores and proficiency levels actually represent. 11
| PISA scores | Proficiency levels |
|---|---|
| Scaled points used to show the average performance of students in a country. | Describe what students can typically do at different points on the PISA scale. |
| Scores are reported separately for mathematics, reading and science. | Each subject is divided into levels, from simpler skills at lower levels to more complex reasoning at higher levels. |
| A higher score generally indicates stronger average performance, but small differences should be interpreted alongside statistical uncertainty. | Level 2 is commonly used as a foundational proficiency level, indicating that students have reached a basic threshold of knowledge and skills. |
| A country’s average score does not show how every student performed; students can be distributed across several proficiency levels. | Students at higher proficiency levels can generally handle more complex and unfamiliar tasks than those at lower levels. |
The PISA rankings are constructed based on the average score for each subject. Statistical uncertainty could happen for several reasons:
- Only a sample of students is tested.
- Different students would produce slightly different results if a different sample were selected.
- Students answer a limited selection of test questions rather than every possible question.
So, it's best to conclude that two countries performed similarly (like Country A has a mean score of 501 while Country B has a mean score of 499) when their results are not statistically different.
Additionally, it is important to examine trends in factors associated with performance while recognising that correlation (when two things are related) does not necessarily imply causation (when one thing causes a change in another).
For example, PISA 2025 found a strong association between students’ socio-economic status and their science performance. Across OECD countries, socio-economic status was associated with about 12% of the variation in science performance.
However, this does not mean that students who come from higher-income or more advantaged families automatically score higher. Other factors (like school conditions, teaching quality) could also be involved.
What factors affect student achievement?
Some other factors revealed in the PISA study include:

What can PISA teach us about education?
Here's what PISA can or cannot tell us about education, on its own. While it has its strengths, this global assessment also has its limitations and criticisms.
✅ What PISA can tell us
- How students apply knowledge and skills in reading, mathematics, and science.
- How education systems compare and how performance changes over time in different countries.
- How education systems compare and how performance changes over time in different countries.
❌ What PISA cannot tell us
- Everything that students learn, because PISA covers only selected domains.
- The reason why one education system performs differently: PISA scores alone cannot identify a single cause.
- The overall quality of an education system: creativity, character, and wider well-being are not fully captured.
What do PISA findings mean for students, parents and tutors?
Beyond theoretical statistics and statements, PISA findings should offer practical insights for students, parents, and tutors, especially in terms of learning strategies.
🎓 For Students
- Develop reasoning and problem-solving skills by working with real-world data and evidence
- Build reading comprehension and evaluation skills without over-reliance on AI
- Cultivate independent and digital learning habits
👨👩👧👦 For Parents
- Encourage curiosity, problem-solving and independence in learning
- Understand that holistic education should go beyond memorisation
- View PISA results as one source of information, rather than a complete picture of a child's abilities
👩🏫 For Teachers
- Incorporate a wide range of real-world problems alongside curriculum-based teaching
- Use diagnostic activities that highlight reasoning and explanation to identify gaps in understanding
- Encourage metacognition and independent learning.
We hope you have enjoyed reading this article and understanding what the PISA data entails, as well as the right way to interpret them. Keep your eyes set on the next PISA assessment in 2029!
References
- “PISA Frequently Asked Questions (FAQs).” OECD, n.d., https://www.oecd.org/en/about/programmes/pisa/pisa-frequently-asked-questions-faqs.html. Accessed 30 Sept. 2026.
- National Center for Education Statistics. “Program for International Student Assessment (PISA)—Overview.” NCES, n.d., https://nces.ed.gov/surveys/pisa/overview.asp. Accessed 30 Sept. 2026.
- Organisation for Economic Co-operation and Development. “The PISA Target Population and the PISA Samples: PISA 2025 Results (Volume I).” OECD, 8 Sept. 2026, https://www.oecd.org/en/publications/pisa-2025-results-volume-i_73451bc5-en/full-report/the-pisa-target-population-and-the-pisa-samples_fb064025.html. Accessed 7 Oct. 2026.
- Organisation for Economic Co-operation and Development. PISA 2029. 2025, https://www.oecd.org/content/dam/oecd/en/about/programmes/edu/pisa/publications/brochures/PISA-2029-Brochure.pdf. Accessed 7 Oct. 2026.
- Organisation for Economic Co-operation and Development. “PISA 2025 Learning in the Digital World.” OECD, 2024, https://www.oecd.org/en/topics/sub-issues/learning-in-the-digital-world/pisa-2025-learning-in-the-digital-world.html. Accessed 7 Oct. 2026.
- Organisation for Economic Co-operation and Development. “PISA 2025: Students’ Reading and Mathematics Performance Declined Sharply across the OECD.” OECD, 2026, https://www.oecd.org/en/about/news/press-releases/2026/09/pisa-2025-students-reading-and-mathematics-performance-declined-sharply-across-the-oecd.html. Accessed 7 Oct. 2026.
- Organisation for Economic Co-operation and Development. PISA 2025 Results (Volume I)—Country Notes: Beijing, Shanghai, Jiangsu and Zhejiang (B-S-J-Z) (China). 2026, https://www.oecd.org/content/dam/oecd/en/publications/reports/2026/09/pisa-2025-results-volume-i-country-notes_88d1164e/beijing-shanghai-jiangsu-and-zhejiang-b-s-j-z-china_e7cfc7e3/d0c85572-en.pdf. Accessed 7 Oct. 2026.
- OECD Education and Skills Today. “The State of Global Education, According to PISA.” OECD Education and Skills Today, 8 Sept. 2026, https://oecdedutoday.com/the-state-of-global-education-according-to-pisa/. Accessed 7 Oct. 2026.
- Li, J., E. Xue, and S. Guo. “The Effects of PISA on Global Basic Education Reform: A Systematic Literature Review.” Humanities and Social Sciences Communications, vol. 12, no. 1, 2025, https://doi.org/10.1057/s41599-025-04403-z.
- Jeffreys, B. “England Up in Reading, Maths and Science Rankings as Scotland and Wales Dip.” BBC News, 8 Sept. 2026, https://www.bbc.com/news/articles/cvgy6n0l4rdo. Accessed 7 Oct. 2026.
- Organisation for Economic Co-operation and Development. Guidelines on the Use of the PISA for Schools Data. 2025, https://www.oecd.org/content/dam/oecd/en/about/projects/edu/pisa-based-test-for-schools/Guidelines%20-%202025.pdf. Accessed 7 Oct. 2026.
Summarise with AI:
Did you like this article? Leave a rating!

 Loading...